

The rise of US technology mega-caps has led to the US stockmarket dwarfing the markets of other countries. Several of the largest US companies, such as Nvidia, Apple or Alphabet, each have individual values which are comparable with – or bigger than – the total value of the entire stockmarkets of other countries such as the UK or Japan.
As a result, investors around the world are used to having large US allocations. If they based their portfolios on a global stock index such as the MSCI World, they would have 70% of their portfolio in US stocks (as of the end of April 2026).
But although the US stockmarket is by far the world’s biggest, it does not always generate the biggest returns.
The chart below shows how the fortunes of the US market have fluctuated in recent months, based on quarterly returns compared with other countries’ markets.
Win some, lose some: the US stock market vs other countries
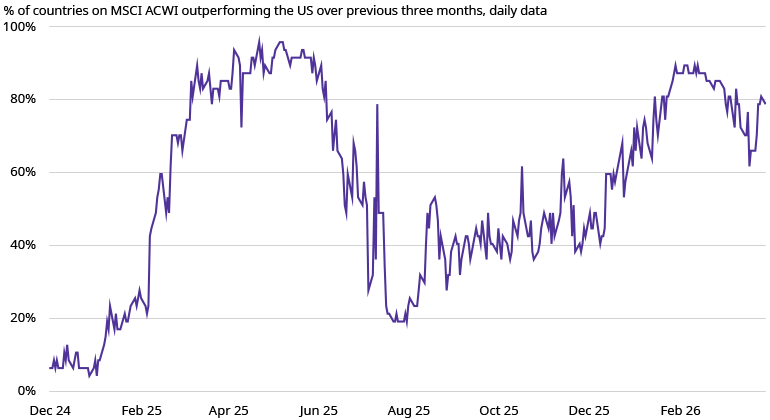
Source: MSCI, Schroders, as of 31 March 2026.
Looking at 35 years of data provides a bigger picture, but fluctuations are still clear.
The heatmap below plots annual returns by size and by region, with larger returns ranked at the top of the table.
The US – shaded blue – is top of the table for 12 out of the 35 years. It is bottom for seven years out of the 35, and is also bottom for the year 2026 to date.

The US has been bottom of the pile for 7 in the past 35 years
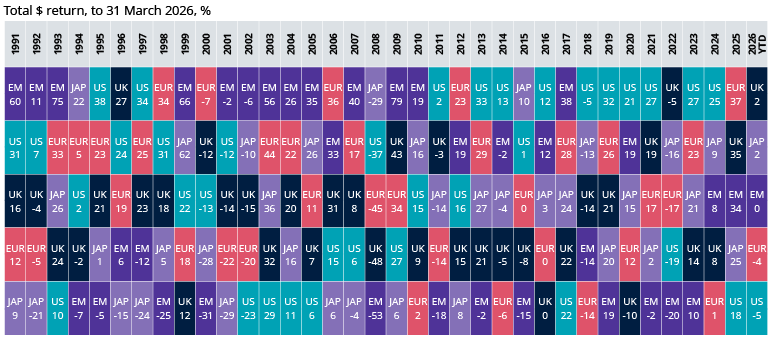
Europe = Europe ex UK. Source: LSEG Datastream, MSCI and Schroders. Data to 31 March 2026 in US dollars.
The “US exceptionalism” that is evident in many of the post-financial crisis years may lead you to assume that this has always been the case. But the heatmap highlights that markets go through cycles. In many earlier years the US lagged other stock markets. Emerging markets frequently had top billing. If we were to look back even further, we’d see that it was Japan leading the way in the 1980s.
When one market has performed better over a number of years, its weight in the index goes up, leaving investors with an outsized “bet” that it will continue to do best. History has shown the risks of extrapolating in that way.
An active approach to global equity investing can look beyond the geographic composition of an index, and seek to understand the prospects facing individual industries and companies.
Important information
Marketing material for financial professionals only.
All investments involve risk, including loss of principal.
The views and opinions contained herein are those of Schroders and may not necessarily represent views expressed or reflected in other Schroders communications, strategies or funds. Such opinions are subject to change without notice. The material is not intended as an offer or solicitation for the purchase or sale of any financial instrument(s). The material is not intended to provide, and should not be relied on for, accounting, legal or tax advice, or investment recommendations.
Any reference to regions/ countries/ sectors/ stocks/ securities is for illustrative purposes only and not a recommendation to buy or sell any financial instruments or adopt a specific investment strategy. Past performance is not a guide to future performance and may not be repeated. The value of investments and the income from them may go down as well as up and investors may not get back the amount originally invested. Diversification cannot ensure profits or protect against loss of principal.
This document may contain “forward-looking” information, such as forecasts or projections. Please note that any such information is not a guarantee of any future performance and there is no assurance that any forecast or projection will be realized.
Schroder Investment Management North America Inc., 7 Bryant Park, New York NY 10018-3706. CRD Number 105820. Registered as an investment adviser with the US Securities and Exchange Commission.