Bob Iaccino, for CME Group
At a Glance:
- Copper futures gained 41% in 2025, driven by demand forecasts and policy uncertainties.
- S&P Global projects copper demand will reach 42 million metric tons by 2040, up 50% from current levels, driven by electricity consumption rising at a similar pace.
Copper entered 2026 as one of the best-performing industrial assets. After a 41% rally in 2025 that saw CME Group Copper futures settle at $5.6820 a pound, the red metal pushed above $6.00 in January. This surge comes as a "triple threat" of AI data centers, electric vehicle scaling and grid modernization collides with a decade of mining underinvestment. While the long-term bull case is firming, traders are navigating a volatile short-term landscape defined by U.S. tariff policy and thinning global inventories.
The question for 2026 isn't whether copper faces headwinds, but whether structural demand can override policy volatility and mine constraints.
Electrification Drives Structural Deficit
The emergence of artificial intelligence (AI) as a primary copper consumer has fundamentally altered the market's demand profile. S&P Global forecasts copper demand swelling to 42 million metric tons by 2040 – a 50% jump from current levels – driven by a near-50% rise in electricity needs.
The key drivers include AI data centers, which consume 40,000-50,000 tons per major facility, electric vehicles (EVs) that use three to four times more copper than conventional cars and renewable energy grids. China, which absorbs about 60% of global refined copper, remains the epicenter, with power infrastructure accounting for over 60% of demand growth through 2030. Defense spending and urbanization in emerging markets add further upside to the equation.
This structural shift matters because it creates inelastic demand across multiple sectors simultaneously – data centers, EVs and renewable grids – leaving little room for substitution. Chinese manufacturing data and U.S. hyperscaler buildouts now function as leading indicators for price direction.

Supply Crunch Deepens
Compounding those demand pressures, supply-side bottlenecks represent a critical factor to monitor, with forecasts pointing to a deepening deficit. J.P. Morgan projects a 330,000-ton refined copper shortfall in 2026, the largest gap in years, and the causes are structural.
Let’s start with the mines themselves. Output has faltered in Chile, Peru and Panama due to strikes and environmental hurdles. But the bigger problem is quality: ore grades have fallen to below 0.6%, half what they were 25 years ago. Miners are digging deeper and processing more rock just to extract the same amount of copper.
New supply isn't coming fast enough to help. Mine development takes seven to 10 years, and discovery rates have plummeted 70% since the 1990s. Add water scarcity – freshwater is essential for extraction, processing and cooling equipment, yet 40% of production regions face shortages – and you have a supply chain that is stretched.
The numbers paint a stark picture: global inventories sit below three weeks of consumption. Recycling covers only 30%-32% of needs. DBS Bank projects the deficit could widen to 316,000 tons, enough to potentially sustain record prices.
For traders, this tightness can amplify volatility. It's worth monitoring these three signals daily:
- CME Group warehouse stock reports.
- Production output from miners like BHP or Rio Tinto.
- Mine disruption news.
Tariff Uncertainties and Geopolitical Risks
In 2025, tariffs reshaped supply chains. A 50% tariff on semi-finished copper products, implemented August 1, 2025, pushed U.S. import premiums to a record $1.30 per pound. The White House has floated the idea of 15% duties on all copper imports starting in 2027, potentially rising to 30% by 2028.
Geopolitical flashpoints, particularly tensions in South America, add additional risks to the 45% of U.S. imports coming from Mexico, China and Canada. These uncertainties could exacerbate deficits by encouraging stockpiling or driving substitutions toward alternatives like aluminum, while a weaker USD boosts copper's appeal.
Traders should keep an eye on new copper announcements, rulings on tariffs and trade flows as any escalations could trigger significant volatility, which could favor hedges on CME Group Copper futures and options.
What’s Priced In
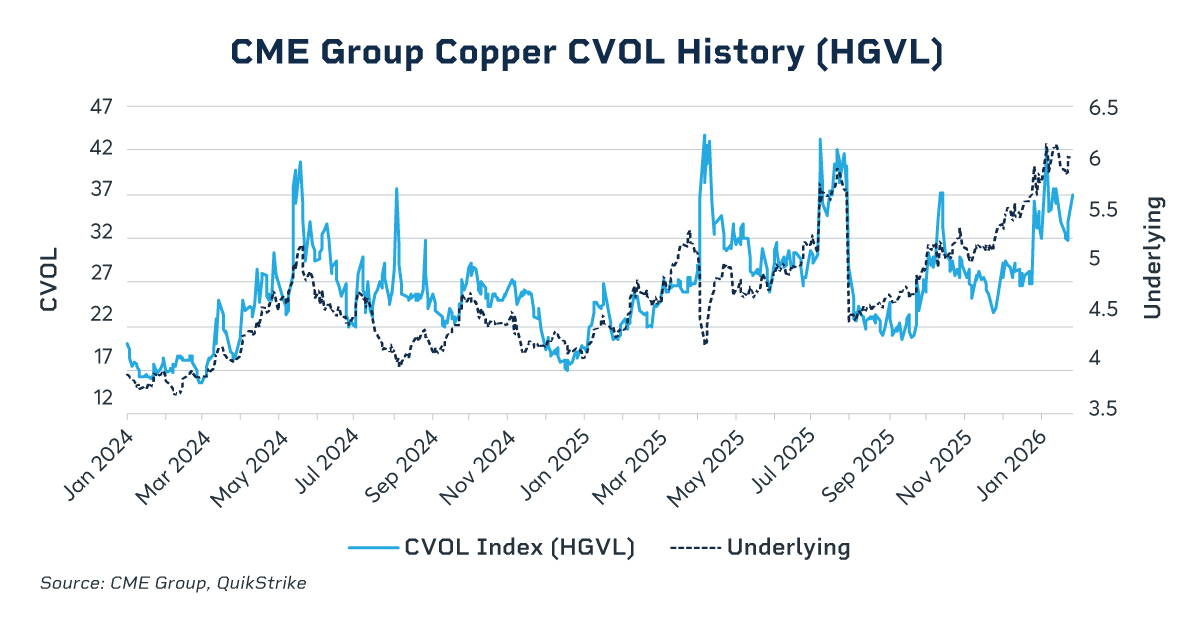
Consensus forecasts point to a $5.00-$6.35 range for 2026, though Goldman Sachs projects a 160,000-ton surplus that could pressure prices. Implied volatility (CVOL) above 31 reflects uncertainty around Federal Reserve policy and potential Chinese stimulus.
For futures traders, the setup favors hedging strategies over directional bias. The fundamentals support higher prices, but policy risk creates two-way volatility. CME Group warehouse stock reports and Chinese PMI releases offer the clearest near-term signals.
Looking at the bigger picture, copper's strategic role in AI infrastructure and green technology underscores its long-term appeal. Traders who ignore these fundamental shifts could miss the next significant move in what remains one of the market's most essential industrial commodities.
CME Group futures are not suitable for all investors and involve the risk of loss. Full disclaimer. Copyright © 2026 CME Group Inc.