Chris Farran, CME Group
At a Glance:
- The options-adjusted spread (OAS) represents the compensation investors require for taking on the credit risk associated with corporate debt.
- The OAS in the U.S. Corporate High Yield Very Liquid (HY) Index can reveal the market’s appetite for risk.
The Federal Reserve’s September interest rate cut has triggered a shift in the corporate bond market, with spreads in both high yield and investment grade bond indexes reaching near-historical lows. This signals that investors feel positive both about this decision and the Fed’s comments signaling the potential for additional easing this year.
While both indexes had a similar response to these developments, there are still some fundamental differences between them. Looking at the OAS spreads between the Bloomberg U.S. Corporate Investment Grade (IG) Index and U.S. Corporate High Yield Very Liquid (HY) Index – which underpin CME Group’s Bloomberg Credit futures – reveals different perspectives on risk and volatility within each of their respective credit markets.
What is the OAS?
OAS measures the credit premium investors demand for holding corporate debt compared to risk-free U.S. Treasury securities. This spread compensates investors for the risk that a company might default. During periods of market uncertainty, investor risk aversion increases, causing the OAS to widen as they demand a higher premium to hold corporate bonds.
The HY Index, which tracks bonds from companies with lower credit ratings, is significantly more sensitive to these shifts in market sentiment. Its OAS is prone to relatively large and rapid increases, a direct reflection of the heightened risk and volatility in the high yield bond market. This sensitivity makes it a powerful barometer for capturing market-wide risk appetite.

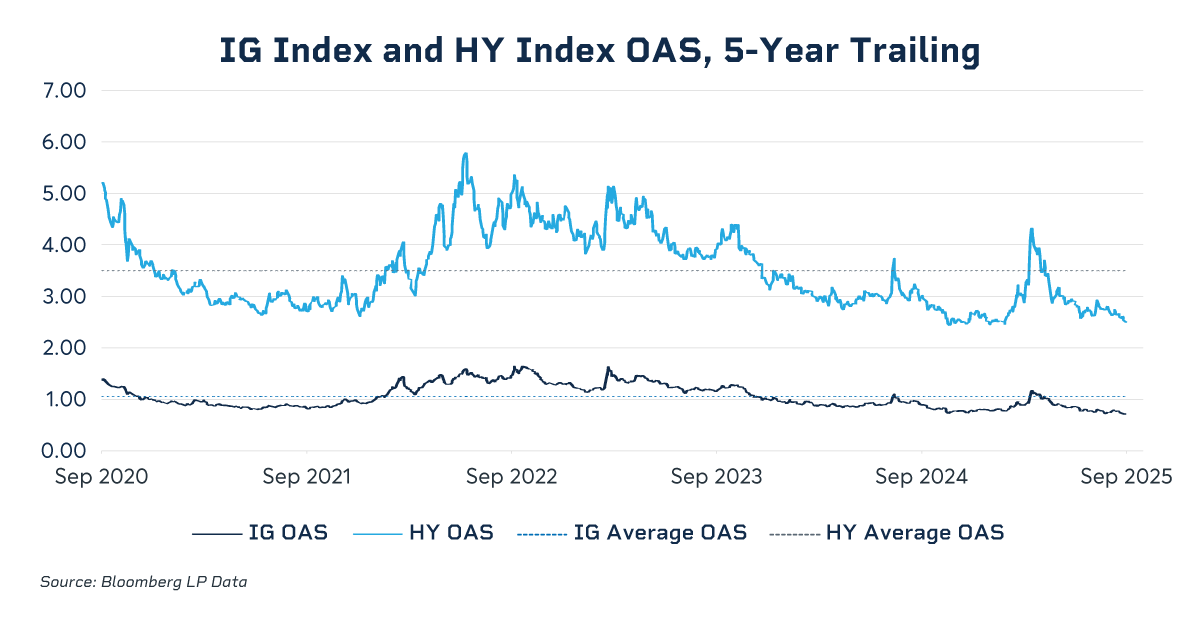
Over the last five years, the average OAS for the IG Index is 1.06%, and the average for the HY Index is 3.50%. Both indexes’ OAS are currently low relative to their five-year averages as of September 22, 2025, indicating a lower risk credit market:
- The IG Index OAS of 0.71% on this date is in the bottom 0.06% percentile over this period – only one day had a lower OAS than this figure.
- The HY Index OAS of 2.50% on this date is in the bottom 1.50% percentile over this period – only 20 days had a lower OAS than this figure.
Volatility: Where HY and IG Indexes Differ
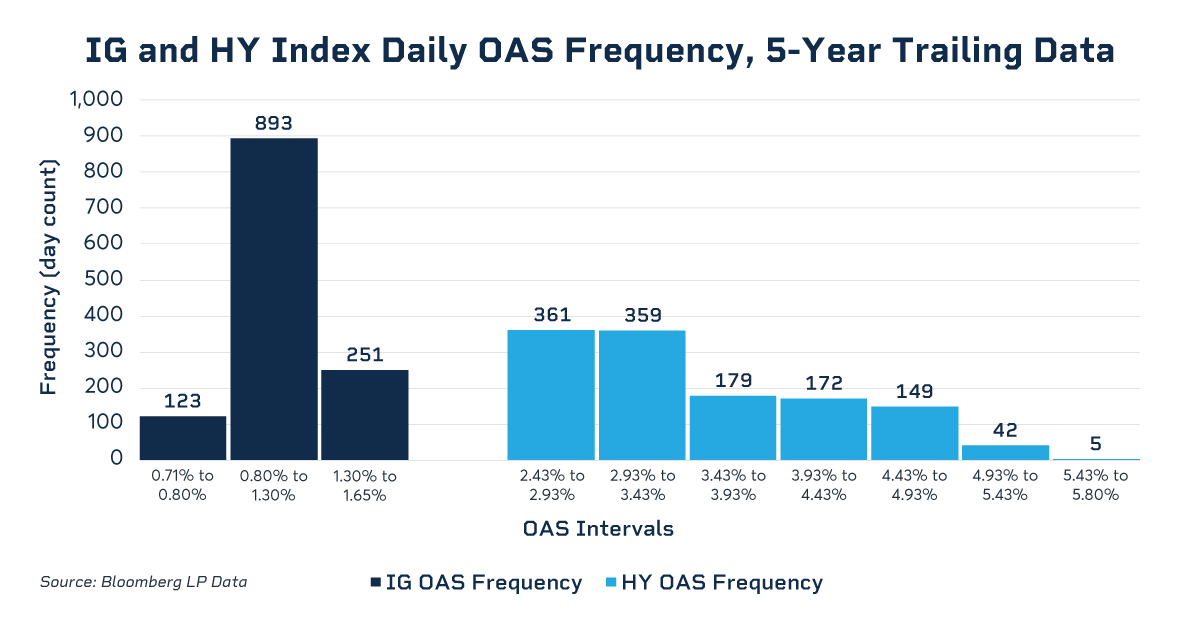
A comparison of the OAS statistical distributions reveals that the indexes typically exhibit different levels of volatility. The distribution of the HY Index's OAS is skewed to the right, indicating that its OAS is more likely to experience large, sudden increases rather than gradual changes. For instance, over a five-year period, the HY Index had a broad OAS range of 2.44% to 5.80%. The standard deviation, a measure of volatility, was 0.74%, underscoring the considerable risk and potential for price swings in this market.
In contrast, the IG Index, which tracks debt from more financially stable companies, demonstrates far less volatility. Its OAS range over the same period was a much tighter 0.71% to 1.64%, with a standard deviation of just 0.23%. These metrics illustrate the stability and lower risk typically associated with investment-grade corporate bonds.
Trading the HY-IG Spread
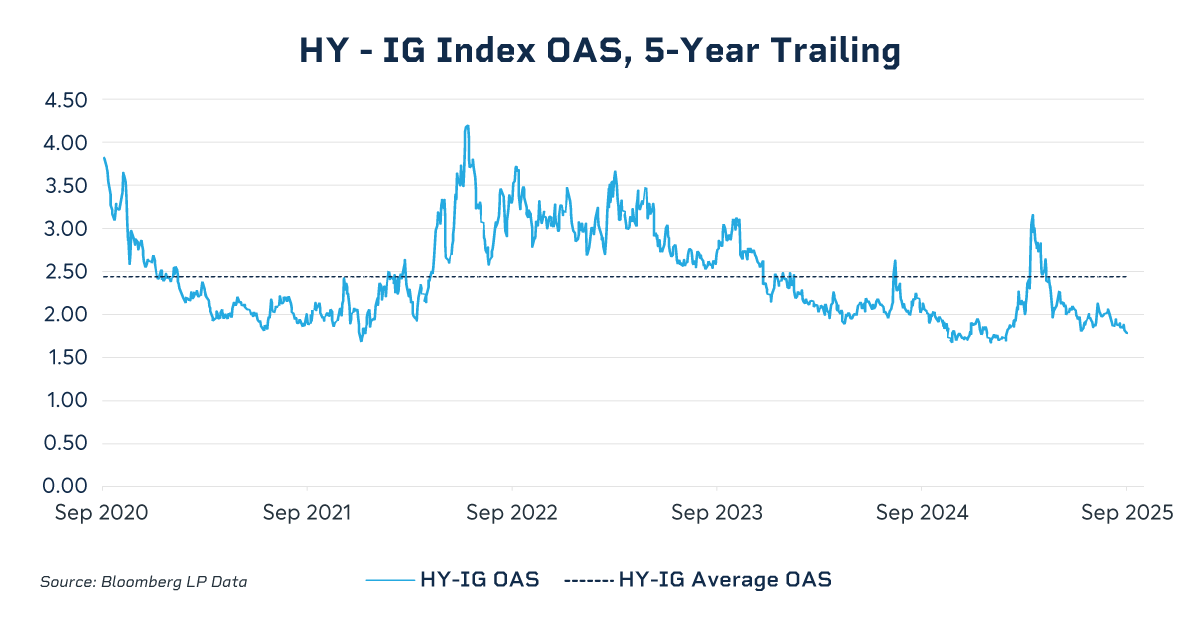
The clear differences in the OAS behavior between the two indexes provide a compelling rationale for trading the spread between them. The HY less IG OAS spread is critical to credit traders who anticipate either a widening or tightening of the gap in credit premiums between the two markets.
- Over the trailing five-year period, this spread has an average of 2.44%, a standard deviation of 0.53% and a range between 1.67% and 4.20%.
- As of September 22, 2025, this spread was 1.78%, signaling a relatively strong high yield market.
- This volatility and range make the spread itself a tradable asset.
To facilitate this targeted strategy, CME Group offers the IGHY Inter-Commodity Spread (ICS), which allows market participants to trade the spread between the Investment Grade (IQB) and High Yield (HYB) futures contracts. A key benefit of this structure is the approximate 70% margin offset provided between the IQB and HYB components, which significantly improves capital efficiency.
By capturing these distinct market characteristics, CME Group's Bloomberg Credit futures, and especially the IGHY ICS, provide market participants with essential tools for hedging and speculating on the nuanced dynamics of the corporate debt market.
CME Group futures are not suitable for all investors and involve the risk of loss. Full disclaimer. Copyright © 2025 CME Group Inc.