Erik Norland, CME Group
AT A GLANCE
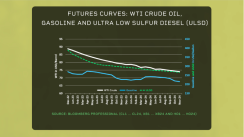
- The futures curves for crude oil, gasoline and ultra-low sulfur diesel are in backwardation
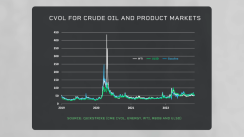
- CME Group’s CVOLTM Index for crude, gasoline and ULSD is showing that implied volatility is roughly twice its pre-pandemic level, suggesting that traders aren’t too confident in the scenario of lower prices
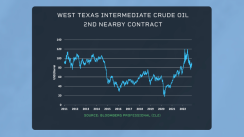
Hardly! In the past month, oil prices have barely moved. They jumped briefly from $81 to $93 on OPEC news, but they have since lost most of their gains and are trading over $30 per barrel less than they were in June.
Moreover, if you look at the futures curves for crude oil, gasoline and ultra-low sulfur diesel, those curves are all in backwardation – suggesting that traders think that spot prices are more likely to be lower in the future. Apparently, traders think that continuing COVID-19 restrictions in China and slowing growth globally will hamper demand and more than offset the impact of low inventories and less OPEC+ production.
This, however, is not the full story. If one looks at CME’s CVOLTM for crude, gasoline and ULSD, one finds that the implied volatility on these products’ options trades at around 50%. That’s roughly twice the pre-pandemic level, and it suggests that traders aren’t too confident in the scenario of lower prices.

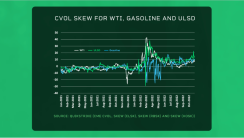
Further, if one looks at the skewness of CVOLTM on crude and product options, one finds that traders price a higher risk of extreme upside moves in prices than extreme downside.