Erik Norland, CME Group
AT A GLANCE
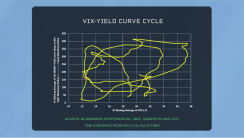
- The VIX-yield curve cycle is a powerful economic phenomena that has persisted since at least the end of the 1980s
- Two-year average yield curve slopes and VIX levels move in a four-stage cycle
Is the economy headed into recession? If so, could this weird chart contain the secret to finding out when a downturn might begin? New research from the Federal Reserve suggests that the answer might be yes.
A recent research piece by the Richmond Fed’s Anne Lundgaard Hansen suggests the above chart contains the best indicator of turning points in the business cycle. Her paper, “Predicting Recessions Using VIX-Yield-Curve Cycles,” is based on research into the cyclical relationship between monetary policy and market volatility that CME Group began publishing five years ago.
In order to make sense of the data, let’s break it down into bite-sized pieces. What initially looks like random noise is actually a repeating cyclical pattern that breaks down into four parts.
First, recessions happen following periods of tight monetary policy, characterized by flat yield curves and high levels of equity volatility.

Second, once a recession gets underway, the Fed eases policy, steepening the yield curve.
Third, by the middle of an expansion, equity volatility subsides, and the Fed begins to tighten policy.
Fourth, in the late stages of an expansion, a tight monetary policy has flattened the yield curve, and equity market volatility begins to rise before the economy dips into another downturn.
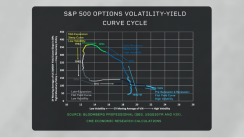
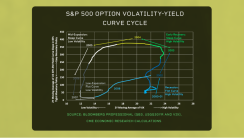
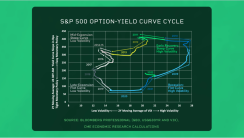
Over the last 31 years, the cycle has repeated three times, but recently it has taken a new twist. Fed tightening is beginning to flatten the yield curve and equity volatility is beginning to rise. So, we might be headed into the lower right-hand corner of the chart, the part typically associated with recessions. But we are not there yet.
Read more articles like this at OpenMarkets