Farhan Mustafa, CFA
Yaoqin Li
Key Takeaways
- The stocks of high-quality firms — characterized by good profitability, growth, safe financial position and high payout to shareholders — tend to outperform both low-quality firms and the broader market over time and across geographies.
- High-quality firms also tend to experience lower variability and reduced drawdowns during recessions.
- Our research suggests the quality factor can play a useful role in the stock selection process and, given its low correlation to other common factors, provides diversification benefits in portfolio construction.
Constructing a Factor for Stock Quality
Low interest rates and market enthusiasm for speculative stocks have created a challenging environment for high-quality stocks — those companies with higher profitability, greater sustainability of profits and low debt, for example. Yet high-quality stocks have characteristics that would seem to make them attractive long-term holdings, suggesting recent challenges are an anomaly.We theorize that high-quality firms should generate a higher return than low-quality firms over time and test this theory here by constructing a factor for stock quality. To identify high-quality firms, we decomposed the Gordon Growth Model, a method of determining the current value of a company’s stock as the sum of its future dividends discounted back to their present value. The Gordon Growth Model provides a good indication of the underlying characteristics of quality:

Given the role of the Gordon Growth Model in identifying price in the price/book value ratio, a decomposition of the P/B ratio using the Gordon Growth Model yields four subfactors that form the basis of the definition of quality in our model:
We posit that, all else equal, companies with higher profitability, growth of profitability, lower required rates of return (which we treat as safety: investors should pay a higher price, or a lower required rate of return, for a safer stock) and higher payout ratios to shareholders should exhibit higher returns.

The quality factor in our model, then, consists of four components — profitability, growth, safety and payout — each with different underlying measures:
- The profitability subfactor measures a firm’s profitability and consists of return on equity (ROE), return on assets (ROA), cash flow over assets (CFOA), accruals over assets (ACC) and operating profitability over assets (OPOA).
- The growth subfactor measures the growth in the five profitability measures over the past five years and consists of growth(ROE), growth(ROA), growth(CFOA), growth(ACC) and growth(OPOA).
- The safety subfactor measures the financial strength of firms using leverage (LEV), net debt/earnings before interest, taxes, depreciation and amortization (EBITDA), and interest coverage ratio (INTCOV).
- The payout subfactor measures the payout ratio to the common shareholders of the firm using the change in split-adjusted shares (EISS) and change in dividend per share (DIV) over the past year, the number of consistent annualized dividend per share increases over the past 25 years (DIVINC) and the annual owner’s yield (OWNERYIELD).
- Thus, a high-quality company may be characterized by high profitability, high growth in the profitability metrics, a strong financial position and consistent and high payouts to shareholders.
Our Investable Universe
We began with a universe of all common stocks, REITs and MLPs listed on U.S. exchanges while excluding most ADRs. We then filtered out stocks whose trailing three-month average daily volume (ADV) was below the 25th percentile and whose market cap was below the 20th percentile of the Russell 3000 Index. This translated to a minimum tradeable ADV of about $2.37 million and minimum market cap of about $336 million as of June 2020. By doing so, we tested our factor using only stocks in which an active U.S. institutional equity manager could realistically have taken meaningful positions. We will also include selective ADRs that such a manager might invest in.Portfolio Performance
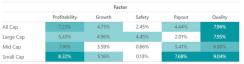
We generated scores for each of the four subfactors of quality by averaging the standardized rank of each underlying variable in the subfactor. For example, the profitability subfactor was constructed as the average of the standardized ranks of ROE, ROA, CFOA, ACC and OPOA of a stock relative to the universe. The quality score was then computed as an average of the profitability, growth, safety and payout scores. The top quintile of quality scores was classified as high quality, while the bottom quintile was classified as low quality, and the same methodology was applied to all four subfactors.We found that between January 1986 (when sufficient data for our purposes became available) and June 2020, high-quality portfolios consistently outperformed low-quality portfolios. Exhibit 1 shows the average annualized differences in value-weighted forward returns (calculated on a rolling basis with monthly rebalancing) between high-quality and low-quality portfolios (in the Quality column). These represent the excess return of being long the top quintile of quality and short the bottom quintile of quality. The average annualized long-short value-weighted returns of the four subfactors are also displayed in Exhibit 1.
Exhibit 1: Annualized Returns of the Quality Factor and Subfactors
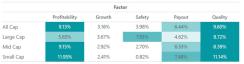
Source: ClearBridge Investments. Return measures the average annualized differences in value-weighted forward returns between the high-quality and low-quality portfolios, calculated on a rolling basis with monthly rebalancing. All periods January 1986 to June 2020.
To help illustrate Exhibit 1 we can make a few observations. For example, the performance of the overall quality factor was robust across all size cohorts, and the all cap quality factor generated an annualized return of 9.60% for the time period examined. Furthermore, the performance of several subfactors was also robust for the same time period. For instance, the all cap profitability subfactor had an annualized return of 9.13%, and the all cap payout subfactor had an annualized return of 6.44%. By aggregating the subfactors, the quality factor improves the performance of the individual factors, even though some individual subfactors might perform better in subsamples of the data.
The quality factor also has strong performance in market drawdowns, with annualized returns of 18.0% during recession periods, illustrating that the factor benefits from flight to quality in volatile periods (Exhibit 2).
Exhibit 2: Cumulative Returns of the Quality Factor
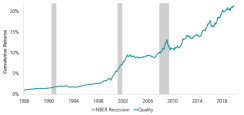
Source: ClearBridge Investments. January 1986 to June 2020. NBER recession dates are used.
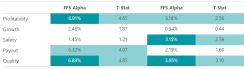
We also regressed the monthly returns of quality and its subfactors against the Fama-French three-factor model (FF3) and five-factor model (FF5) to test the quality factor return after excluding the impact of the other common factors including the market, size, value/growth, profitability and investment. Exhibit 3 shows the annualized regression alphas and t-stats for the back tests. Although the subfactors have varying regression alphas, the quality factor has statistically significant positive alphas with respect to both Fama-French factor models. The quality factor has an annualized alpha of 8.24% and a significant t-stat of 6.72 with respect to the FF3 model, and an annualized alpha of 5.45% and a significant t-stat of 5.06 with respect to the FF5 model, illustrating that the quality factor consistently delivered positive risk-adjusted returns and is a robust factor distinct from other common factors at the 5% level of significance (at which level of testing a t-stat of 1.96+ indicates significance).
Exhibit 3: Annualized Regression Alphas and T-Stats for the Quality Factor and Subfactors
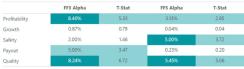
Source: ClearBridge Investments. January 1986 to June 2020. Regression alphas are annualized.
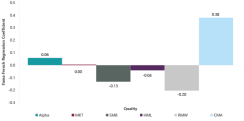
The quality factor has negative coefficients with the market, size, and value factors, and provides diversification benefits against these factors (Exhibit 4). The statistically significant positive coefficient with the robust minus weak (RMW) factor is expected, as this factor measures the performance of high-profitability firms against low-profitability firms and has similar characteristics to the profitability subfactor.
Exhibit 4: Regression Coefficients of the Quality Factor Against Fama-French Factors
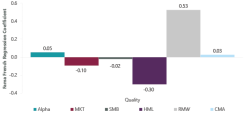
Source: ClearBridge Investments. January 1986 to June 2020.
The correlation matrix between the quality factor and its subfactors indicates that the subfactors have relatively low correlations to each other and provide distinct signals to identify high-quality firms (Exhibit 5). We also back-tested the equal-weighted forward returns of quality and its subfactors, and we find that the conclusions are similar to the value-weighted forward returns discussed above. Thus, the quality factor is robust in both equal-weighted and value-weighted specifications.
Exhibit 5: Correlation Coefficients between the Quality Factor and Subfactors
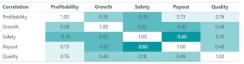
Source: ClearBridge Investments. January 1986 to June 2020.
Factor Implementation
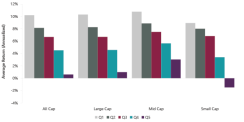
The quality factor exhibits strong and robust performance and our back tests provide support for the robustness and distinctiveness of the factor. We found that across market cap groups, high-quality stocks identified in Quintile 1 tend to generate the highest annualized average returns, while low-quality stocks identified in Quintile 5 tend to generate the lowest returns (Exhibit 6). High-quality firms have lower volatility than low-quality firms as well, as the standard deviation of returns was lower among high-quality stocks (5.01%) than low-quality stocks (5.92%).Exhibit 6: Returns by Quality Factor Quintile
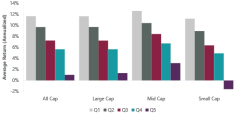
Source: ClearBridge Investments. January 1986 to June 2020.
From January 1986 through June 2020, the quality factor generated an average annualized return of 9.6%, with a relatively low standard deviation of 7.8%, and a Sharpe ratio of 0.83. The maximum drawdown and downside capture of the factor was also significantly lower compared to the broader market. This indicates that the quality factor can generate attractive returns while reducing risk and tends to have strong performance in periods of market drawdowns.
The Global Quality Factor
The performance of the quality factor remains robust in global markets as well.We tested the quality factor and its subfactors in a universe of common stocks, REITs and MLPs listed on global exchanges. This translated to a minimum tradeable ADV of approximately $0.91 million and minimum market cap of approximately $339 million as of June 2020.
The quality factor has similar performance in global markets. We found that between January 1993 and June 2020, high-quality portfolios consistently outperformed low-quality portfolios. The quality factor has statistically significant positive alphas with respect to both Fama-French factor models. In the back test, the global quality factor generated an average annualized return of 7.4%, with a relatively low standard deviation of 7.1%, and a Sharpe ratio of 0.79. The maximum drawdown and downside capture of the factor was significantly lower compared to the broader market. See the Appendix for additional test results.
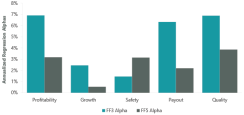
Exhibit 7: Annualized Returns of the Global Quality Factor and Subfactor
Source: ClearBridge Investments. Return measures the average annualized differences in value-weighted forward returns between the high-quality and low-quality portfolios, calculated on a rolling basis with monthly rebalancing. All periods January 1993 to June 2020.
Neutralizing Country Effects in Global Quality Factor
To further test the robustness of the global quality factor, we neutralized country-specific effects to get a sense of whether the factors’ robustness was geography dependent. The results are similar to the original global quality factor, demonstrating that the quality factor is robust in the global markets.Exhibit 8: Annualized Regression Alphas and T-Stats for the Country-Neutralized Global Quality Factor
Source: ClearBridge Investments. January 1993 to June 2020. Regression alphas are annualized.
Exhibit 9: Annualized Regression Alphas for the Country-Neutralized Global Quality Factor against Fama-French
Source: ClearBridge Investments. January 1993 to June 2020.
The Quality Factor Across Time Periods
Examining the U.S. quality factor in three separate longer-term periods, we found that high-quality firms consistently outperformed low-quality firms and the trend persisted through all five quintiles. Thus, the quality factor is also robust in different time periods.Exhibit 10: Average Annualized Returns for the U.S. Quality Factor in Various Time Periods
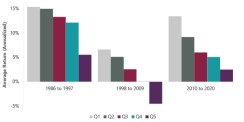
Source: ClearBridge Investments. January 1993 to June 2020.
A Useful Addition to Stock Selection and Risk Management
We believe the quality factor can be a useful addition to both the stock selection and risk management processes. Our back tests provide compelling evidence that high-quality portfolios outperformed low-quality portfolios in aggregate, and the factor was also robust in different model specifications. The profitability, growth, safety and payout subfactors help to identify the key characteristics of high-quality stocks, making the factor a useful screening tool for fundamental stock pickers. The quality factor also has low variability of returns and reduced drawdown during recessions and provides diversification benefits against other common factors.Appendix
Adjustments to AQR’s Quality Minus Junk Factor
In the quality factor construction, we adjusted AQR Capital’s Quality Minus Junk factor based on empirical research and economic theory. We used trailing 12-month financial data when available instead of fiscal data to reflect up-to-date information in our model. In the profitability subfactor, gross margin and gross profitability over assets were substituted for operating profitability over assets as operating profitability is more closely tied to sustainable value creation. We also adjusted operating profitability by a measure for research and development costs and neutralized for different industries, as these costs drive sustainable value creation in certain industries. In the growth subfactor, the five-year growth in the respective profitability ratios was used. For the safety subfactor, we focused on financial statement strength and debt coverage ratios, and removed bankruptcy measures such as Altman’s Z-Score and Ohlson’s O-Score, which were less relevant to non-manufacturing firms. For the payout subfactor, the magnitude and consistency of dividend increases and owner’s yield were included as these are key components of total payout received by shareholders. Furthermore, we adjusted the factor construction for firms in the financials sector, as many accounting variables such as accruals and total debt should be interpreted differently for these firms. Our data is neutralized by industry for only the OPOA factor, and the subfactors are adjusted specifically for the financials sector.Additional Test Results of Quality in Global Markets
Exhibit 11: Annualized Regression Alphas and T-Stats for the Global Quality Factor and Subfactors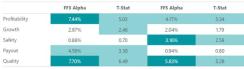
Source: ClearBridge Investments. January 1993 to June 2020. Regression alphas are annualized.
Exhibit 12: Regression Coefficients of the Global Quality Factor Against Fama-French Factors
Source: ClearBridge Investments. January 1993 to June 2020.
Exhibit 13: Average Annualized Returns in the Global Quality Factor Quintiles
Source: ClearBridge Investments. January 1993 to June 2020.