By Eric Leininger, CME Group
AT A GLANCE
- CME Group's CVOL includes out of the money options to examine the inner workings of markets
- New upward and downward volatility features helped spot FX volatility trends in the early pandemic period
CME Group’s new CVOL indexes completely capture constant 30-day implied volatility and clarifies it through a unique prism that generates new sets of robust volatility indices.
Built on CME Group’s options products, CVOL provides related indicators containing information across the front-end of the volatility surface. CME Group built CVOL to easily separate and recombine parts of the surface related to calls and puts to deliver Upward Variance from out of the money (OTM) calls, called UpVar, and Downward Variance from OTM puts called DnVar. These variance tools provide insight into possible asymmetry in the implied volatility curve by isolating the market’s variance estimate to just the call or put wing of the volatility surface.
CVOL also delivers the additional indicator Skew. Skew is the measure of the tilt between the asymmetry of the volatility surface. CVOL Skew is calculated easily by subtracting DnVar from UpVar. Positive Skew implies volatility is increasing as prices rise while negative Skew implies volatility is rising while prices fall. Because CVOL captures a rich palette of options, Skew provides holistic insights to the entire volatility surface around the 30-day point.
Visualizing Volatility Moves

By including all out of the money put and call options for a given expiration, CVOL captures the full essence of volatility surfaces and by extension more information about volatility. Foreign exchange markets offer an example.
Exhibit 1: CVOL Indices for AUD, CAD, EUR, GBP and JPY versus USD
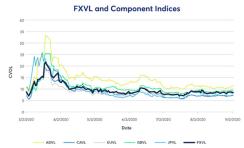
Exhibit 1 shows CVOL indexes for G5 currency pairs against the U.S. dollar during Q2 and Q3 during 2020. In March and April, CVOL spiked, implying that the range of prices could be quite wide in the next 30 days.
After markets settled down in the summer, CVOL continued to point out interesting potential distinctions in the level of future price ranges between currencies. CVOL continued to show, for example, that volatility for AUD/USD remained higher than the other four currency pairs, pointing towards a potentially larger range of prices in the future.
Up and Down
An important part of the new volatility index is the use of out of the money (OTM) calls and puts.
This matters a lot. When markets price larger outcome for puts, then the DnVar will increase in value. Likewise, if the market is pricing a more favorable outcome in calls, then UpVar will increase.
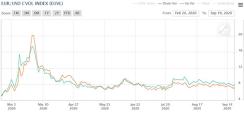
Market movements in EUR/USD during March 2020 provide a clear view of why these insights are important. UpVar and DnVar quickly moved higher, but DnVar eventually moved much higher. Early in March, call options were pricing larger outcomes than puts.
However, once the significance of the pandemic came to light, the DnVar related to puts spiked much higher. While CVOL correctly showed that overall implied volatility was rising quickly, UpVar and DnVar showed how the different parts of the surface were moving.
Exhibit 2: EUR/USD Up and Down Var
Skew Too
Here are the key points to remember about Skew movements:
- Positive Skew—implies the options market is expecting implied volatility to rise as the underlying future rises, a positively correlated ‘price-vol’ relationship
- Negative Skew—implies the options market is expecting implied volatility to rise as the underlying future falls, a negatively correlated ‘price-vol’ relationship
Exhibit 3: EUR / USD Skew
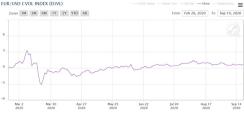
Skew in EUR/USD remained negative until mid-summer when it breached the zero boundary. It has remained in positive territory since then. Nevertheless, the Skew index remains an important one to watch closely.
New Horizons
Options traders are always seeking the most comprehensive data to help them prepare for the unexpected. This new, wide-ranging look across options volatility aims to more efficiently help them do just that.