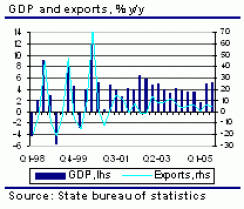
The merchandise trade resulted in a higher deficit in Q3 due to the continuing strong import growth. Still, thanks to the somehow slowing domestic consumption, merchandise imports grew at a slightly decelerating rate in Q3 too. In terms of value added, the biggest contribution to overall economic growth had the sectors of financial intermediation (7.8% y/y in almost two years), hotels and restaurants (7.6%, fastest since Q1 of 2004), trade (6.1%) and industry (6.0%). The GDP growth in Jan.-Sept. accelerated to 4.1% y/y against 3.5% in H1, which prompted the finance ministry to revise up its full-year projection to 4.0% y/y from previous 3.9%. The ministry said that industry and retail trade continued growing in the last quarter of the year. Industrial output rose by 7.1% y/y in October and 6.3% in November while retail trade added real 1.7% y/y in October.
| GDP growth, r eal change, % y/y | |||||||
| Q1-04 | Q2-04 | Q3-04 | Q4-04 | Q1-05 | Q2-05 | Q3-05 | |
| Household consumption | 3.9 | 3.8 | 4.0 | 3.8 | 2.4 | 4.4 | 3.8 |
| Government consumption | -1.6 | 0.7 | 0.3 | -0.6 | -0.1 | 1.0 | 1.0 |
| Gross fixed capital formation | 8.9 | 7.7 | 0.5 | 0.9 | 0.3 | 3.2 | 5.8 |
| Exports of goods and services | 6.4 | 3.9 | 5.5 | 5.8 | 1.0 | 6.7 | 4.9 |
| Imports of goods and services | 5.9 | 5.4 | 3.2 | 0.0 | 2.1 | 5.8 | 2.3 |
| Total | 4.2 | 3.8 | 3.6 | 3.6 | 1.8 | 5.1 | 5.2 |
| Source: Statistical office | |||||||