While the US is locked in the throes of Trumper tantrums and investigations, political risk is easing in Europe. Emmanuel Macron’s victory in the French presidential election has stemmed the wave of populism for the moment. With a lurch to Le Pen avoided, the region’s improving growth dynamics beg the question: Should you ride the wave with an active manager, or back the beta with an ETF?
In the first quarter of this year, more than €14 billion flowed into large-cap European equities. Macron’s triumph means more is likely to follow. Around 60 percent of that money went to active, large-cap funds – but should it have?
Back the beta
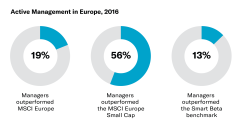
If broad, large-cap indices are your thing, then 2016 was very much the year of the ETF. According to Lyxor’s annual deep dive into the performance of 3,800+ active funds in Europe, fewer than one in five European managers outperformed, unlike in 2015 when nearly three-quarters of them achieved the feat.* Even though 2015 was such a good year, Lyxor’s research showed that managers were unlikely to repeat the trick; very few large-cap managers outperform consistently. When it comes to Europe’s blue chips, it’s better to back the beta.
What was striking about last year was the huge swing in performance. Having outperformed by, on average, 3.3 percent in 2015, active managers underperformed by 2.9 percent in 2016. Most were overexposed to factors like momentum, low beta, and low quality, and underexposed to value.
Size matters

Factor timing was crucial, but most managers also had to contend with too great an exposure to mid- and small-caps. Stock picking also had a negative effect, as it has since Lyxor started its study four years ago. Alpha generation won’t be any easier this year.
There are pockets of the market where active management did indeed do what it says on its tin. For example, 56 percent of European small-cap managers outperformed in 2016, with the best 25 percent outperforming by nearly 9 percent, on average; this is because company fundamentals continue to drive performance, rather than the style or sector rotation that can hinder large-cap managers.
European small-cap managers have also been some of the standout performers over the last decade, with nearly a third outperforming.
Country matters, too
National identities are more important, economies are on different trajectories, and valuations vary quite widely. Not for the first time, most European markets are trailing in Germany’s wake. The catch-up potential is clear, and so is the evidence on performance.
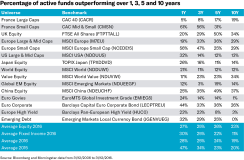
Take France, for example. Only 5 percent of active funds outperformed the CAC 40 in 2016, vs. 59 percent in 2015; alpha generation was at its lowest ebb, and fewer managers outperformed here than anywhere else. Dig deeper, however, and the picture changes: 65 percent of managers outperformed the CAC Mid & Small Index, some to a significant degree.
In Italy, you had a one in two chance of finding an outperforming manager. In Spain, the number was more like one in three, while in Germany, it was fewer than one in 10. In most cases, beta was the better bet.
Only the very best managers outperform minimum variance indices. Smart Beta’s success in 2015 was no fluke, as only 13 percent of active funds outdid the FTSE Europe Minimum Variance Index. Very few have done it over 10 years.
In Europe, Lyxor provides more than 40 ways to engage with the markets, including the world’s largest ETFs on several core European indices, like the MSCI Europe, CAC40, FTSE 100, IBEX 35, and FTSE MIB1. True to its commitment to performance, Lyxor provided the most efficient ETFs for six out of 10 core index exposures in 2016.
*Source of all data in this story: Lyxor ETF Research, Morningstar, and Bloomberg data from 31/12/2006 to 31/12/2016.The figures relating to past performances refer to past periods and are not a reliable indicator of future results. This also applies to historical market data.
This communication is for professional clients only.
This document is for the exclusive use of investors acting on their own account and categorised either as “Eligible Counterparties” or “Professional Clients” within the meaning of Markets In Financial Instruments Directive 2004/39/EC.
This document is of a commercial nature and not of a regulatory nature. This document does not constitute an offer, or an invitation to make an offer, from Société Générale, Lyxor International Asset Management, or any of their respective affiliates or subsidiaries to purchase or sell the product referred to herein.
We recommend to investors who wish to obtain further information on their tax status that they seek assistance from their tax advisor. The attention of the investor is drawn to the fact that the net asset value stated in this document (as the case may be) cannot be used as a basis for subscriptions and/or redemptions. The market information displayed in this document is based on data at a given moment and may change from time to time. The figures relating to past performances refer or relate to past periods and are not a reliable indicator of future results. This also applies to historical market data. The potential return may be reduced by the effect of commissions, fees, taxes, or other charges borne by the investor.
Lyxor International Asset Management (Lyxor ETF), société par actions simplifiée, having its registered office at Tours Société Générale, 17 cours Valmy, 92800 Puteaux (France), 418 862 215 RCS Nanterre, is authorized and regulated by the Autorité des Marchés Financiers (AMF) under the UCITS Directive and the AIFM Directive (2011/31/EU). Lyxor ETF is represented in the UK by Lyxor Asset Management UK LLP, which is authorised and regulated by the Financial Conduct Authority in the UK under Registration Number 435658.