With the year 2016 nearly halfway finished, the results of two of the most widely followed equity indexes have diverged, with American companies, as represented by the S&P 500 index outperforming the STOXX 600 of Europe in terms of both fundamentals and stock returns.
The year started out poorly for both indexes as they began reporting their financial results for the fourth quarter of 2015. The S&P 500 reported an aggregate earnings decline of 2.9% while revenue for the index fell 3.5% as low oil prices weighed on earnings within the energy sector. Earnings for the STOXX 600 actually increased by 32.1% in Q4, but this result needs to be taken with a big grain of salt. This growth was largely driven by two banks that had large losses in the prior period, making for easy year over year comparisons. If those two banks were excluded, the growth rate would have been -1.0%. On the revenue side, the companies within the STOXX 600 reported a fall in sales of 5.3%.
After a quarter in which companies in both the U.S. and Europe reported generally weak results, the bad news continued throughout the Q1 2016 reporting season which started in April. Both indexes saw earnings and revenue fall, as seen in the exhibit below. Once again, the culprit was the energy sector, which reported earnings down 106% in the S&P 500 and 53% in the STOXX 600.
Exhibit 1. S&P 500: Q1 2016 earnings vs. expectations
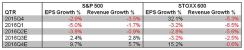
Source: Thomson Reuters I/B/E/S
Looking ahead to the rest of the year, analysts are expecting stronger results, especially for U.S. companies. Analyst currently expect further declines in earnings and revenue in the second quarter earnings season, followed by a return to both top and bottom line growth in the third and fourth quarters. They are not as optimistic about Europe, however, as sales are expected to continue to slide throughout the year and earnings are expected to fall until the fourth quarter, when they are expected to rebound off of the year prior’s low base.
Along with the analysts projecting weak earnings at the beginning of the year, investors sent prices downward initially, with the S&P 500 losing 9.1% and the STOXX 600 losing 14.9% when the index levels bottomed on February 11, as seen in the exhibit below. Since that time, both indexes have rebounded, with the S&P 500 currently up 4.0% year to date and the STOXX 600 down 3.8%. The difference in price performance is mirrored by the difference in expectations for the underlying companies’ fundamentals, as the S&P 500 is expected to see earnings rebound earlier and to see top line revenue growth once again. While the STOXX 600 has been subject to greater volatility recently due to the Brexit debate, the index clearly underperformed the S&P 500 for the majority of the year.

Exhibit 2. S&P 500 and STOXX 600 relative price performance
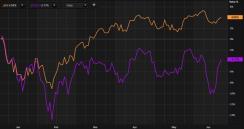
Source: Thomson Reuters Eikon
When it comes to market valuation, the U.S. market has been priced higher by investors than has the European market. At the beginning of the year, investors were paying 15.9 times the expected four quarters of earnings of the S&P 500 but only 14.0 times expected STOXX 600 earnings as seen below in the exhibit. Throughout the year, the P/E ratio for the S&P 500 has continued to increase to the 17.0 current reading. The STOXX 600 P/E ratio dipped at the end of the first quarter to then rebounded to the current 14.7.
Exhibit 3. Forward price to earnings ratios
Source: Thomson Reuters I/B/E/S
For more articles from Thomson Reuters, visit our Lipper Alpha Insight to gain a global perspective on market behavior, investments and funds.
View our Idea of the Week Archive
Learn more about Thomson Reuters I/B/E/S Estimates