Persistently sluggish Chinese growth (at least by its own standards) has sparked a debate about the country’s medium-term prospects. China’s potential growth rate has slowed in the past few years, but markets have not developed any consensus about the new trend pace. The economy expanded on average by 6.5 percent quarter-on-quarter (seasonally adjusted annual rate) in the first half of 2013. Although the sequential rate of inflation has slowed marginally — suggesting that potential growth may lie slightly above that mark — the authorities have not expressed any great dissatisfaction with the economy’s performance. The government has thus implemented little or no policy easing. In this context, observers have proposed a very wide range of views about the outlook.
Conditions specific to China itself — demography, the technology-transfer pattern, financial deepening and so on — should inform expectations for the country’s future growth. In addition, information can come from the experience of other countries. South Korea and Taiwan seem particularly interesting considering that China’s development path thus far has looked somewhat similar to theirs. All three countries experienced a period of very fast growth tilted toward industry, accompanied by rapid expansion of credit intermediation alongside high domestic saving rates (though less so in Korea’s case). What do Korea and Taiwan tell us about China’s possibilities from here?
Chart 1 shows per capita income in U.S. dollar terms for the three countries, with the first year in each case being the year before the country hit the $1,000 level: 1975 for Taiwan, 1976 for Korea and 2000 for China. From that point, China has been following fairly closely in the other two countries’ footsteps, albeit with a somewhat faster growth rate during the past few years than either Taiwan or Korea in their equivalent periods. China’s per capita gross domestic product in 2012 was about $6,000, compared with $4,600 for Korea and $5,300 for Taiwan at similar stages in their development. Much of that difference reflects appreciation in China’s real effective exchange rate.
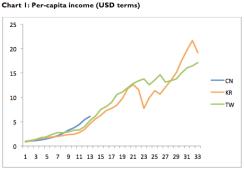
After their per capita GDP hit $6,000 — the position that China is currently in — both Korea and Taiwan managed another decade of quite fast growth before running into difficulties. In Taiwan’s case, growth slowed permanently when per capita GDP hit roughly $13,000, downshifting to a developed-market pace. For Korea, the Asian financial crisis interrupted its growth path; following that trauma, growth returned to a rapid clip. Overall growth — including business-cycle downturns — did slow compared with its pre-Asian-crisis rate, albeit not as much as in Taiwan.
Chart 2 shows average annual growth rates (in compound terms) for the period after Korea and Taiwan hit the $6,000 per capita GDP mark. Taiwan reached that stage of development in 1988 and Korea in 1990. For the sake of comparison, China’s real growth rate over the past five years (equivalent to the top line of the Korea and Taiwan tables) was 9.2 percent.

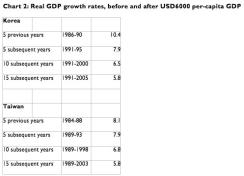
On the chart, Korea’s and Taiwan’s experiences look strikingly similar. Both grew 7.9 percent on average in the five years after hitting $6,000, and both grew 5.8 percent on average in the 15-year period beginning with that half decade. Taiwan did better than Korea in years 6 through 10 (5.7 percent versus 5.2 percent) because the Asian financial crisis depressed Korean growth at the end of that spell. The recovery from that slump helped boost Korean growth in the following five years, and Korea outperformed in years 11 through 15 (4.5 percent versus 3.8 percent).
China’s idiosyncratic characteristics — including what happens with its labor force, how government policy evolves and whether financial stability is preserved — will shape its growth pattern in the years to come. This simple exercise, however, serves as a reminder that China remains far from the global technology frontier: In other words, the income gap between economies like the U.S. and China is still very large. Other Asian economies have managed rapid growth for years after hitting China’s current stage of development. At the same time, even for these success stories, growth rates as economies approach middle-income status have run considerably slower than the rates to which China had become accustomed in recent years. Moreover, many contrary examples exist, especially in Latin America (though the 1980s period of stagnation generally set in at higher income levels than where China stands today).
One final caveat concerns the global atmosphere. Both Korea and Taiwan achieved the strong growth rates identified in the table during the halcyon days of globalization, when international trade volumes were expanding at a breakneck pace and many developing countries were able to gain market share abroad. China’s development from here will occur against a less-friendly global backdrop.